

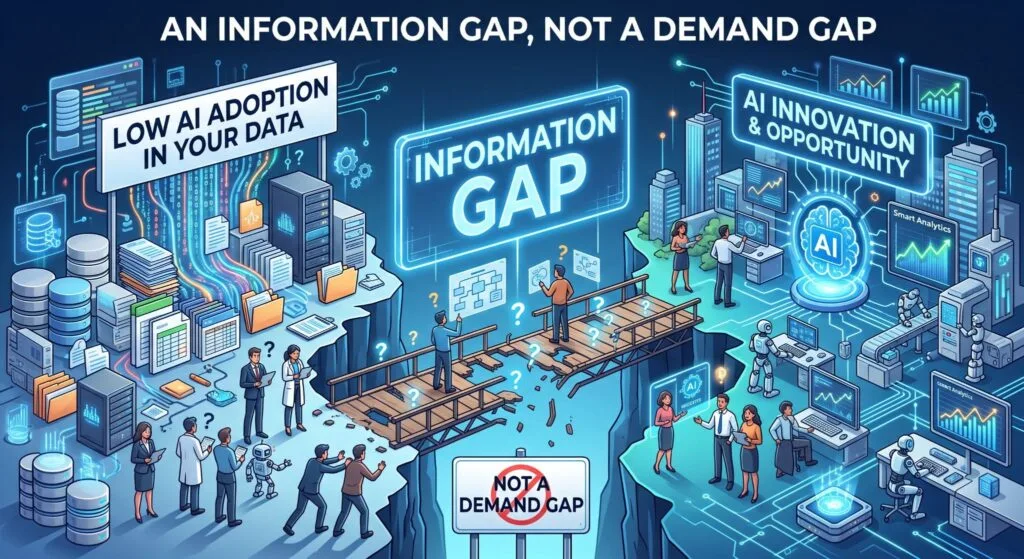

When a feature shows low uptake in one customer segment, most analytics teams reach the same conclusion: that segment does not want it. The dashboard says so, the roadmap adjusts, and the feature quietly loses investment.
That conclusion is often wrong. A low adoption rate measures what customers chose from the options they actually saw. It says nothing about the options they never saw, or saw at the wrong moment.
The 2026 data on AI adoption makes this hard to ignore. Across several large surveys of small businesses, the most-cited barriers are knowledge and awareness, not cost. For data teams, that changes what a low adoption number means and how it should be investigated.
Key takeaways
- Only 14% of small businesses have fully integrated AI into core operations, even though 76% report using it, according to a 2026 Goldman Sachs 10,000 Small Businesses survey.
- U.S. Census Bureau data shows AI use grew among firms with 20 or more employees between December 2025 and May 2026, but did not change significantly among firms with fewer than 20.
- “Lack of knowledge” and “not applicable” dominate non-adoption answers in 2026 surveys, which can signal missing information rather than missing need.
- In one professional translation company’s year of order data, small businesses chose an AI-assisted option eight times less often than large repeat clients, yet 57% of small businesses who ordered it more than once came back for it again.
- Before reading low uptake as low demand, check four things: exposure, repeat behavior, free-text intent signals, and structural exclusions.
Table of contents
- Why AI adoption numbers mislead analytics teams
- What the 2026 barrier data actually says
- What the gap looks like inside real order data
- How do you tell an information gap from a demand gap?
- Fix the decision point before you fix the product
- Questions and answers
- Conclusion
Why AI adoption numbers mislead analytics teams
Headline adoption rates measure whether a business has touched a tool, not whether that tool has become part of the work. The gap between the two is where most segment-level stalls hide.
The Goldman Sachs 10,000 Small Businesses survey from March 2026 shows the pattern clearly. 76% of small businesses said they use AI, but only 14% had fully integrated it into core operations. In the same survey, 73% said they would benefit from more training and resources to implement AI.
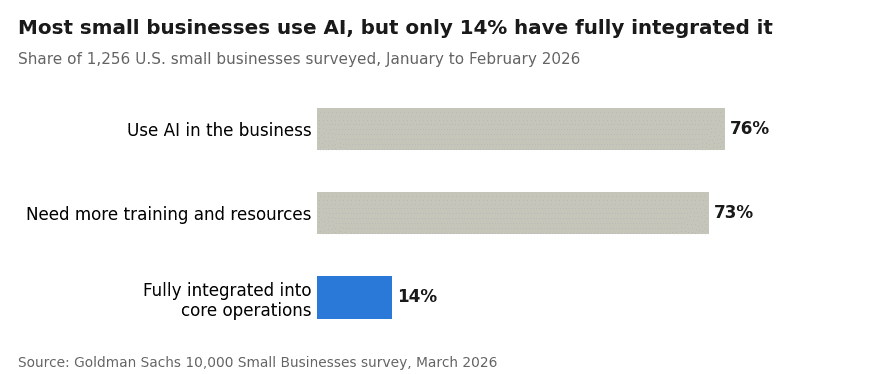
Source: Goldman Sachs 10,000 Small Businesses survey, March 2026
Nationally representative data tells a similar story. An NBER working paper on the Census Bureau’s 2026 AI supplement found that 18% of U.S. firms used AI in at least one business function between November 2025 and January 2026. Among those adopters, 57% used it in three or fewer functions.
The segment split matters most. The Census Bureau’s May 2026 analysis of its Business Trends and Outlook Survey found that AI use increased among firms with at least 20 employees, while use among firms with fewer than 20 did not change significantly.
A flat line in one segment is a data point, not a diagnosis. As this site’s piece on preparing data foundations for enterprise AI at scale points out, what works in a pilot often stalls when it meets a wider group of users. The question is why it stalls.
What the 2026 barrier data actually says
When businesses explain why they have not adopted AI, the answers point to information more often than to price or capability. That pattern repeats across countries and survey designs.
In the Czech Republic, an Ipsos survey for the Association of Small and Medium Enterprises found that 82% of respondents knew ChatGPT, yet 31% named lack of knowledge as a major barrier. Jan Janča of Cognito Digital Agency summarized the finding as “not ignorance of AI, but ‘lack of imagination.’”
In Australia, the National AI Centre’s SME AI Pulse reported that 54% of non-adopting businesses said AI was not relevant to them. The same report noted that more complex applications remain largely untapped, in part because of low awareness. Its framing is direct: “Businesses need to see themselves in the story of AI adoption.”
U.S. data shows the same answer at scale. According to WeWork’s analysis of Census BTOS data from January to July 2026, 61.6% of businesses not planning to use AI said it simply was not applicable to their business.
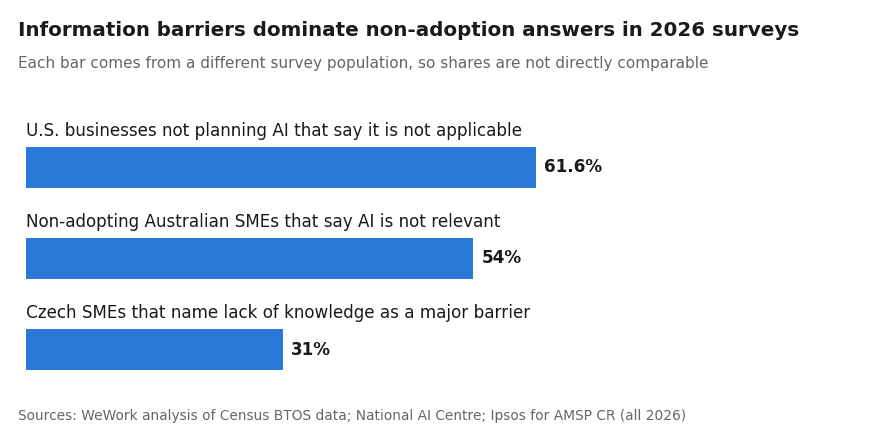
Sources: WeWork analysis of Census BTOS data (January to July 2026); National AI Centre SME AI Pulse (May 2026); Ipsos for AMSP CR (April 2026)
“Not relevant” is a stated preference, but it is formed by what the respondent knows. A business that has never seen AI applied to its own workflow has little basis for judging relevance. For an analyst, that makes “not applicable” a hypothesis to test, not a final answer.
What the gap looks like inside real order data
Survey data shows the barrier. Transaction data shows what the barrier costs. One clear example comes from the translation industry, where buyers choose between full human translation and AI translation with human post-editing (often called MTPE).
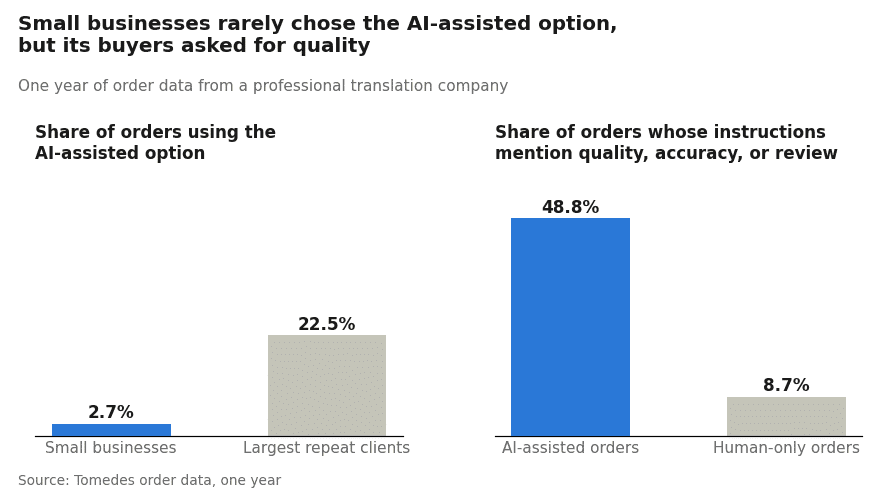
Tomedes, a professional translation company, pulled a year of its own order data and found a sharp segment split. Small business orders used the AI-assisted option 2.7% of the time, versus 22.5% for its biggest repeat clients, such as law firms and agencies placing 10 or more orders a year. That is eight times less often.
Read in isolation, that looks like weak demand. Two other signals in the same data say otherwise:
- Repeat behavior: 57% of small business clients who ordered the AI-assisted option more than once came back for it again. Another 40% had placed only a single order, too early to judge.
- Free-text intent: 48.8% of AI-assisted orders included client instructions mentioning “quality,” “accurate,” “proofread,” or “review,” versus 8.7% of human-only orders.
The data also contained a structural zero. Legal and certified documents showed essentially no AI-assisted usage because the option was not offered for them at all. Any honest comparison has to remove that segment first.
The company’s CEO, Ofer Tirosh, described the conclusion plainly: “I assumed that gap was demand. It isn’t. It’s a conversation that never happened.”
How do you tell an information gap from a demand gap?
You separate the two by testing whether the segment ever had a fair chance to choose. Four checks, run in order, usually settle it.
- Measure exposure before adoption. Confirm whether each segment saw the option at the moment of decision, such as the quote form, onboarding flow, or sales call. Then calculate adoption among exposed users only. A segment that was never shown the option cannot reject it.
- Check repeat behavior among those who tried. A small trial group with a high return rate signals real value and a discovery bottleneck. A low return rate points to a genuine demand or product problem.
- Read the free text. Order notes, form comments, and support tickets often state intent that structured fields miss. Text analytics can flag when a segment asks for outcomes the unused option was built to deliver.
- Rule out structural exclusions. Remove segments where the option is not offered, not eligible, or blocked by policy. Leaving them in drags the adoption rate down for reasons that have nothing to do with demand.
The pattern of results points to the diagnosis:
| Signal | Information gap | Demand gap |
|---|---|---|
| Adoption among exposed users | Much higher than overall rate | Close to overall rate |
| Repeat rate among triers | High | Low |
| Free-text intent | Asks for what the option delivers | Asks for something else |
| Segment eligibility | Option offered but rarely shown | Option offered and shown |
If most signals land in the left column, the fix is communication, not the product.
Fix the decision point before you fix the product
When the checks point to an information gap, the fix usually sits at intake, not in the product roadmap. The goal is to make the option visible and understandable at the exact moment a customer decides.
Three changes tend to matter most:
- Name options plainly. Labels like “Standard” and “Premium” hide what actually changes. Customers in less experienced segments need to see what each option does and when it fits.
- Show it where the choice happens. An option buried on a features page is not an option for someone filling out a quote form. Present it in the flow, then A/B test the placement.
- Explain the accountability. Smaller buyers are often more cautious about AI on work that matters. As this site’s piece on why human judgment remains essential in AI-powered financial controls argues, trust grows when people know who checks the output.
Measurement has to change too. Self-reported surveys capture perception, while behavioral data captures choice. The JPMorgan Chase Institute tracks small business AI adoption through actual payments rather than survey answers. Intuit’s 2026 AI Impact Report combines survey responses from more than 34,000 businesses with payment data from more than 5.3 million, and finds that paid AI adoption is still a minority behavior.
The practical lesson for data teams is to pair both sources. Survey answers explain why. Behavior shows what actually happened after the option was seen.
Questions and answers
Does low adoption of an AI feature always mean low demand?
No. Low adoption often reflects whether customers were shown the option at the moment they decided. Measure adoption among exposed users before concluding that a segment does not want it.
Can survey data alone diagnose an adoption gap?
No. Surveys show what people believe about a tool, including whether it seems relevant. Behavioral data, such as orders, payments, or repeat usage, shows what they do once the option is in front of them.
Is a high repeat rate in a small user group a meaningful signal?
Yes. When most customers who try an option come back for it, the value is real. A small trial group with strong repeat behavior usually means the bottleneck is discovery, not the product.
Should segments where an option is not offered be included in adoption metrics?
No. A segment with no access to an option will always show zero adoption. Including it lowers the overall rate and hides the real pattern in the segments that do have a choice.
Conclusion
Low AI adoption in a segment is one of the easiest numbers to misread. The 2026 data shows that awareness and knowledge, not cost, hold back many smaller businesses. Real order data shows that when those buyers do find an option, many keep using it.
Before cutting investment in a feature with weak uptake, run the four checks on your lowest-adoption segment: exposure, repeat behavior, free-text intent, and structural exclusions. If the gap turns out to be informational, the cheapest fix in your stack may be a clearer label at the point of decision.