

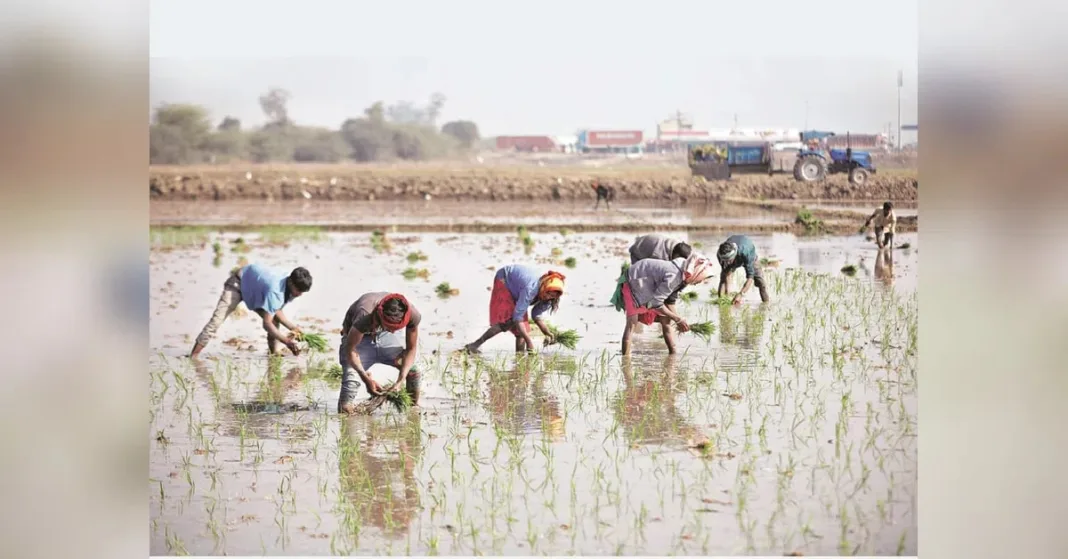

Sowing of kharif crops almost touched the 2025 levels during the week ended August 7, 2026, compared with the same period last year, as the monsoon continued to lash parts of India, though with occasional breaks.
All eyes will be on the performance of the rains over the next few weeks, as that would determine whether India gets a reasonably good harvest during the kharif season and has adequate moisture in the soil to sustain early sowing for the coming rabi season.
Meanwhile, Tanvee Gupta Jain, Chief India Economist, UBS, in a note titled ‘Rural Demand at Crossroads’, discounted a sharp decline in rural demand in FY27 due to a below-par monsoon, saying a sharp slowdown in rural demand appears unlikely as stronger balance sheets (due to back-to-back good crop years in 2023 and 2024), continued government spending and welfare transfers, and supportive credit conditions should help cushion rural incomes and provide a buffer to demand.
She said overall, the group expects rural demand to remain more resilient than in previous episodes of monsoon-related stress, even as growth moderates from current levels.
In the note, Jain also said that they believe that despite El Niño-related concerns, improved farm cash flows (from the previous two good monsoon years), government welfare transfers, GST-related benefits and strong credit growth likely enhanced rural household purchasing power and sustained consumption growth so far in this fiscal.
Kharif Sowing As on August 7, 2026 (in million hectares)
|
Crops |
Normal Area |
2026 |
2025 |
% Change* |
|
Paddy |
41.2 |
34.47 |
36.06 |
-4.4 |
|
Pulses |
12.96 |
10.37 |
10.57 |
-1.9 |
|
Arhar |
4.43 |
3.75 |
4.01 |
-6.5 |
|
Urad |
2.96 |
2.28 |
2.02 |
12.9 |
|
Moong |
3.54 |
3.13 |
3.32 |
-5.7 |
|
Coarse Cereals |
18.26 |
16.85 |
17.32 |
-2.7 |
|
Maize |
8.07 |
8.71 |
9.06 |
-3.9 |
|
Oilseeds |
20 |
18.02 |
17.5 |
3.0 |
|
Soybean |
12.87 |
11.99 |
11.96 |
0.3 |
|
Groundnut |
4.67 |
4.68 |
4.31 |
8.6 |
|
Sugarcane |
5.42 |
5.83 |
5.86 |
-0.5 |
|
Cotton |
12.55 |
10.6 |
10.64 |
-0.4 |
|
Total |
110.44 |
96.79 |
98.58 |
-1.8 |
* From last year
NOTE: Total might not match as it is only of broad crop categories
Source: Ministry of Agriculture
Monsoon so far from (June 1 to August 9, 2026)
|
Region |
Actual* |
Normal* |
% Departure |
|
East & NE India |
628.9 |
843.8 |
-25 |
|
North-West India |
313.6 |
351.8 |
-11 |
|
Central India |
596.8 |
596.2 |
0 |
|
South Peninsula |
350.9 |
425.1 |
-17 |
|
All India |
466.5 |
526.9 |
-11 |
NOTE: Decimals have been rounded off
*in millimeters
Source: India Metereological Department (IMD)